About Query Analytics (QAN)
The Query Analytics dashboard shows how queries are executed and where they spend their time. It helps you analyze database queries over time, optimize database performance, and find and remedy the source of problems.
Query Analytics supports MySQL, MongoDB and PostgreSQL with the following minimum requirements:
- MySQL 5.1 or later (if using the slow query log)
- MySQL 5.6.9 or later (if using Performance Schema)
- Percona Server 5.6+ (all Performance Schema and slow log features)
- MariaDB 5.2+ (for user statistics), 10.0+ (for Performance Schema)
Some limitations and tuning options apply only when using MySQL’s Performance Schema.
See Query Analytics with MySQL.
- PostgreSQL 11 or later
pg_stat_monitorextension (recommended) orpg_stat_statementsextension- Appropriate
shared_preload_librariesconfiguration - Superuser privileges for PMM monitoring account
- MongoDB 6.0 or later (4.4+ may work with limited features)
Requirements for Profiler
- Profiling enabled for Query Analytics
- Appropriate user roles:
clusterMonitor,read(local), and custom monitoring roles. For MongoDB 8.0+: AdditionaldirectShardOperationsrole required for sharded clusters
Requirements for Mongolog
- MongoDB configured to log slow operations to a file
- MongoDB server has write permissions to the log directory and file
- PMM agent has read permissions to the MongoDB log file
- Appropriate user roles:
clusterMonitor, or custom monitoring roles (getCmdLineOptsprivilege on{ cluster: true })
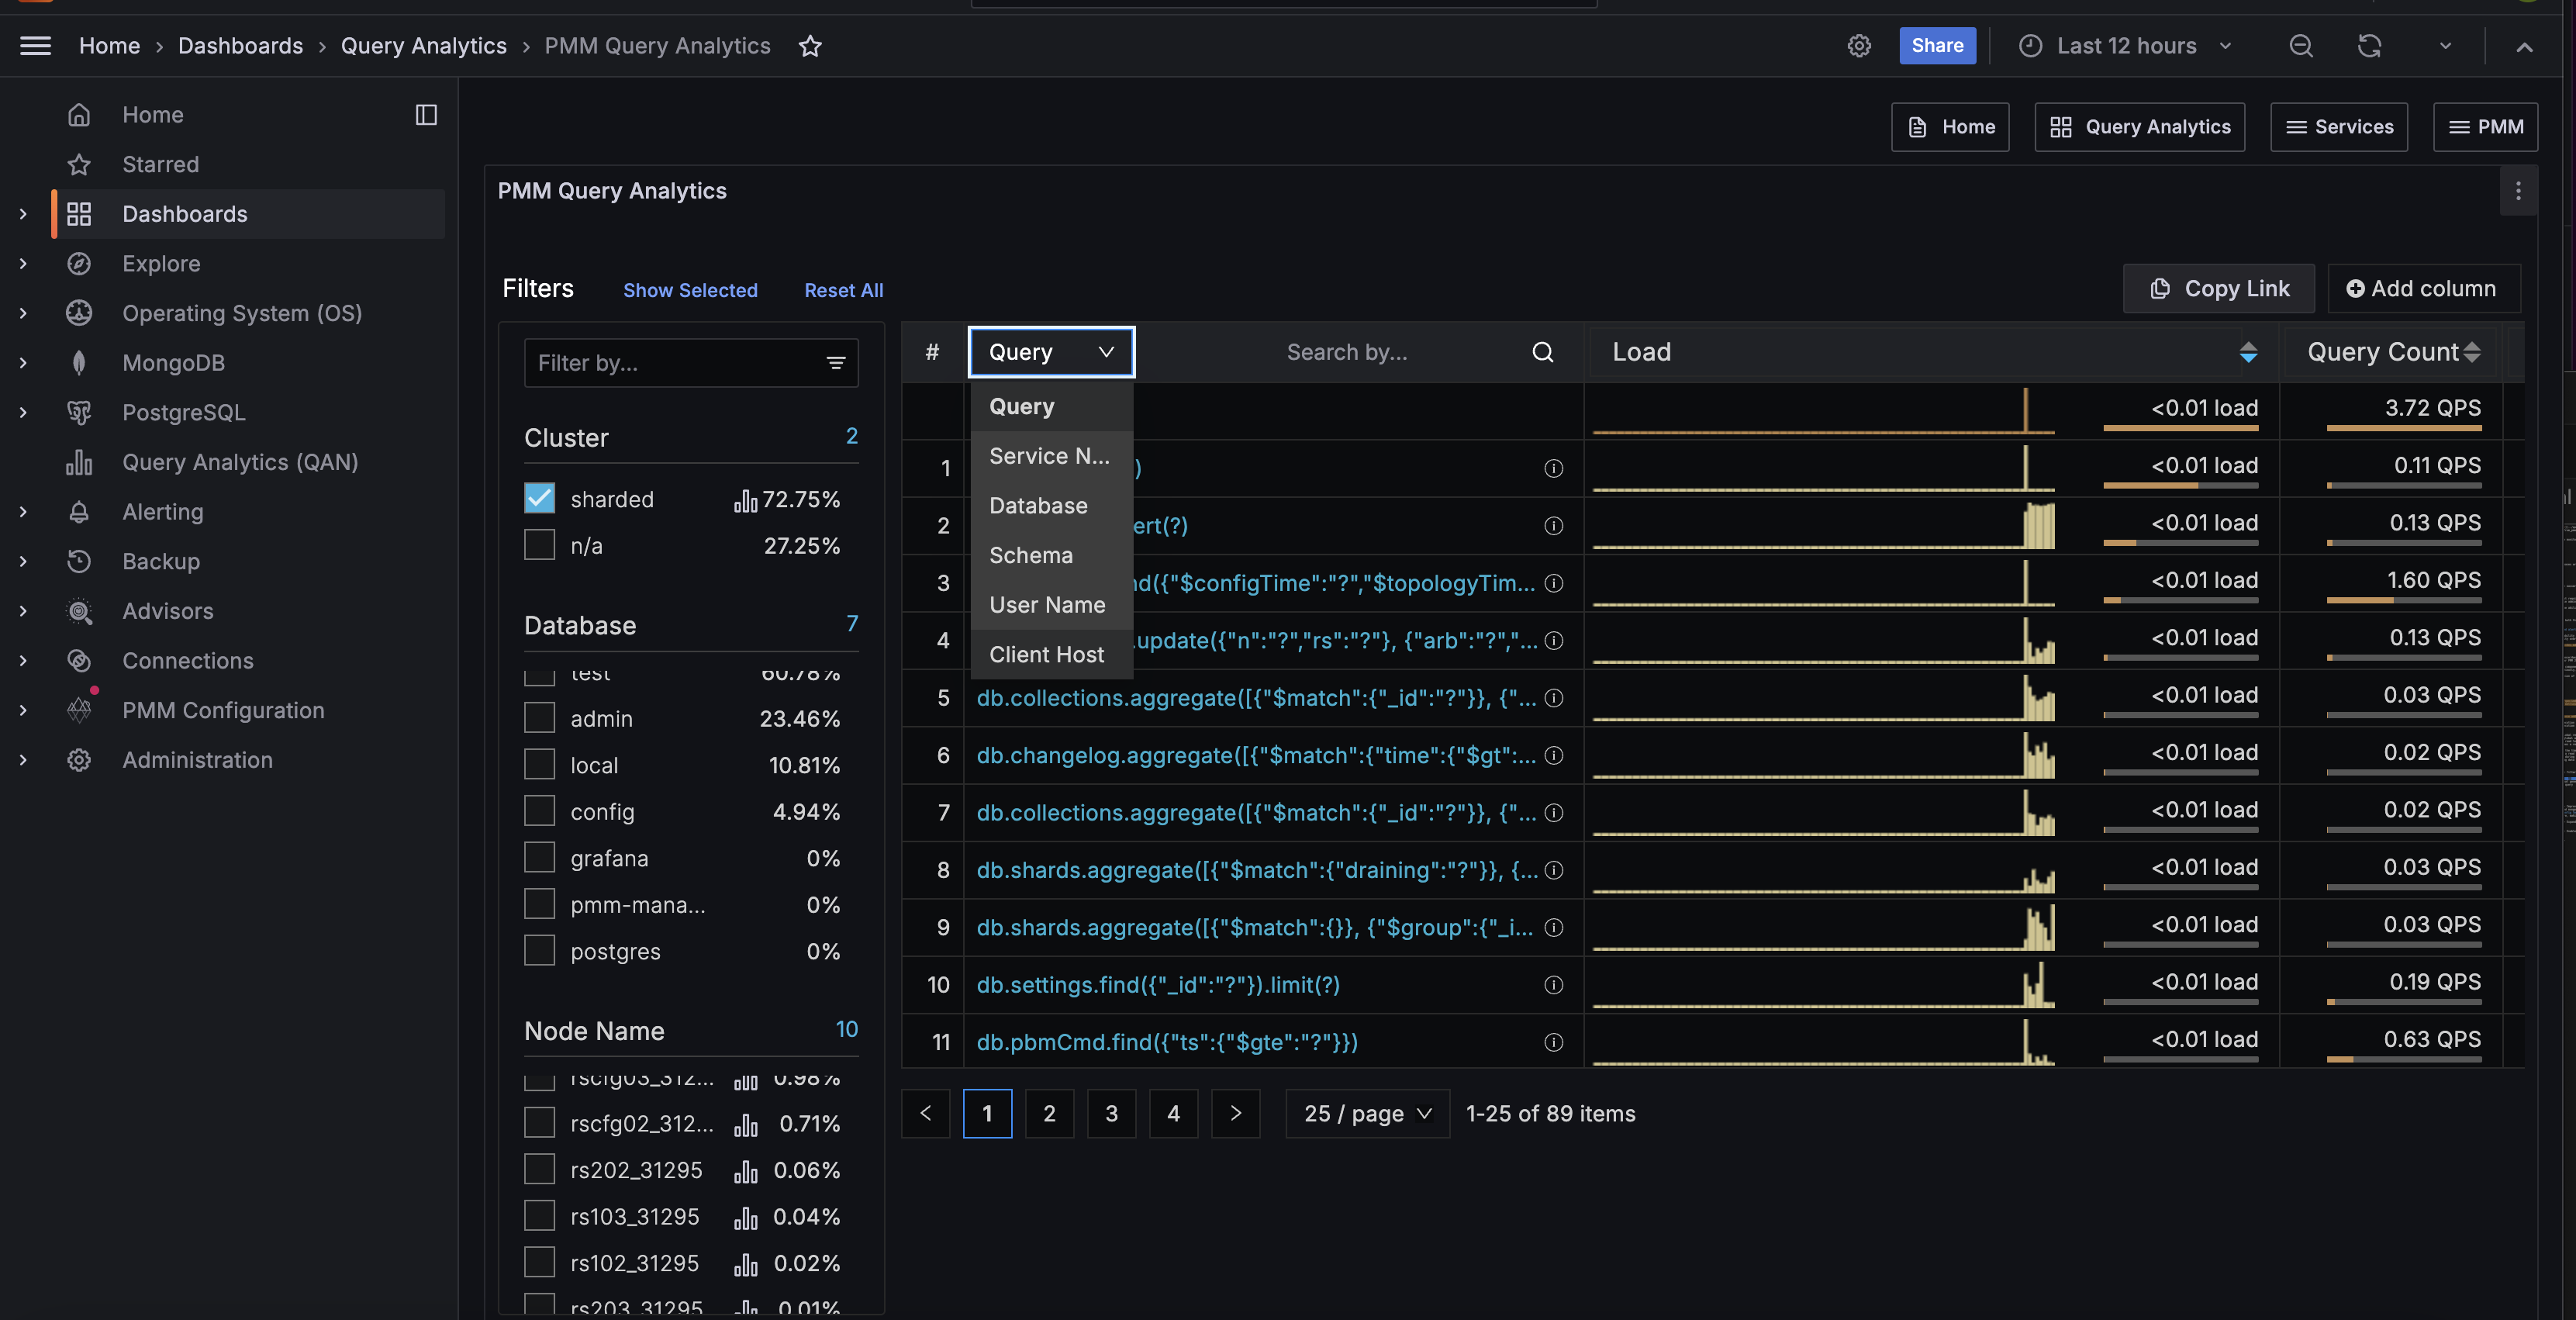
Dashboard components
Query Analytics displays metrics in both visual and numeric form. Performance-related characteristics appear as plotted graphics with summaries.
Dashboard layout
The dashboard contains three panels:
- the Filters panel
- the Overview panel
- the Details panel
Data retrieval delays
Query Analytics data retrieval is not instantaneous because metrics are collected once per minute. When collection delays occur, no data is reported and gaps will appear in the sparkline.
Label-based access control
Query Analytics integrates with PMM’s label-based access control (LBAC) to enforce data security and user permissions.
When LBAC is enabled:
- users see only queries from databases and services permitted by their assigned roles
- filter dropdown options are dynamically restricted based on user permissions
- data visibility is controlled through Prometheus-style label selectors